How Different A/B Testing Tools Affect Site Speed
Originally published on Howuku. Howuku is discontinued; this is an unedited historical copy.

What if the very tools we are using to improve our website’s performance are actually slowing things down?
As digital marketers, we understand the power of a well-optimized, fast-loading website. When it comes to online success, speed matters - a lot. With every second that slips by while your page loads, potential customers can be slipping away. In fact, according to a report by Google, 53% of visitors leave a mobile site that takes longer than three seconds to load.
At the same time, we rely heavily on A/B testing tools to aid us in decision making, shaping user experiences, and optimizing conversions. From headlines to color schemes, these tools are vital for testing out different elements of a website to determine which version performs best.
In this article we are going to explore on how your choice of A/B testing tools can impact your website speed, and in turn, your overall website performance. Don't worry, we have the data with detailed reports and link to actual study to back it up!
Background Information
Let's start with a simple, undisputed fact: Faster websites perform better in every way.
They rank higher in search engine results, provide a better user experience, and most importantly, convert more visitors into customers. In fact, a report by BBC revealed that for every additional second it takes for their site to load, they lose 10% of users.
In the realm of e-commerce, the speed of a website translates directly to revenue. Online giant Amazon found that just a 100ms (that's a tenth of a second!) delay in load time caused a 1% drop in sales. And Google reported that slowing down their search results by just four tenths of a second could result in the loss of 8 million searches per day.

The flip side of this coin is our reliance on A/B testing tools as marketers. A/B testing allows us to continually improve our websites and marketing materials by comparing two versions of a webpage or other marketing asset to see which one performs best. By constantly testing and tweaking, we can increase conversions, improve user experience, and generally make our websites work harder for us.
But could our relentless drive for improvement and optimal performance actually be hampering our efforts? Could the tools we are avidly using to optimize our sites be impacting our website speed?
Disclaimers
Before we dive into the data, it's important to acknowledge that all A/B testing tools aren't created equal - they each have their own limitations and performance issues. Some have faster load times, while others offer more robust features. Some may have larger scripts that might slow your site down, while others focus on optimization and speed. It doesn't get much easier even as you switch your focus from load times to other factors like ease of use, level of customization, and analytics capabilities!
It's crucial to recognize that an A/B testing tool may affect the speed of a website, but that doesn't negate its value. These tools are designed to allow marketers to make data-driven decisions and optimize conversion rates. The enhancements made as a result of these insights far outweigh any potential marginal slowdown. However, it's always a good idea to be aware and considerate of the potential trade-off.
Methodology
We conducted this study with an eye for impartiality and a mandate for precision. Our primary goal was to assess the impact of different A/B testing tools on website speed. To do this, we employed a simple and fair methodology.
Firstly, we ran the test on a very simple website. The site was stripped down to the basics to prevent extraneous factors from influencing our results. It featured a straightforward "Hello World" to "Hello World V2" test.

Why a simple test? Our focus was exclusively on understanding the raw speed of each of the vendors. By using a bare minimum webpage with a simple A/B test scenario, we eliminated the possibility of our results being skewed by any other complex website environment factors, which would disrupt the fairness of the test.
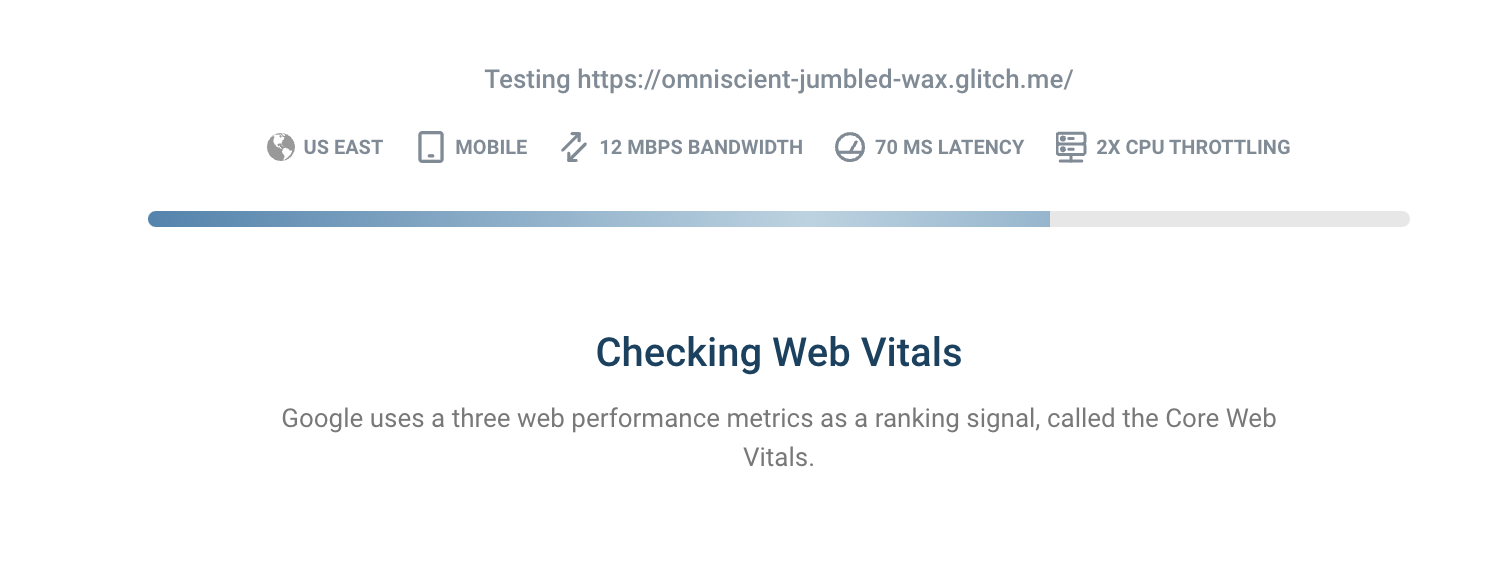
Secondly, the geographical location of the server and the testing environment can influence the speed at which a website loads. To keep things consistent, we conducted all tests in the US East server. This was done in a desktop environment with bandwidth capped at 100 MBPS. Test was conducted on DebugBear.

We compared the following popular A/B testing tools: Mida.so, Google Optimize, VWO, CrazyEgg, Convert Experience, CrazyEgg, and FigPii. The tools were evaluated based on their Load Content Paint (LCP), Start Time To Variant (STTV), Number of requests, and their uncompressed size.
To successfully measure this, we had to understand these parameters:
- Load Content Paint (LCP) measures the time it takes to paint the largest content element visible on the screen. The faster, the better.
- Start Time To Variant (STTV) is the time from the start of the script until the variant is loaded. Again, the faster this happens, the better.
- Uncompressed size. The size of the tool matters because a larger, more complex tool might slow down the website more than a smaller, simpler tool.
By using these metrics, we managed to create a clear, fair and useful comparison that truly represents how these tools can impact your website's speed. Let's take a look at the results.
Results
After running our tests, we discovered a wide variation in the performance of the A/B testing tools. The recorded Load Content Paint (LCP), Start Time to Variant (STTV), and size of each tool were carefully noted and compared. As per the data collected:
1. Impact on LCP

For LCP:
- The fastest tool was Mida.so at 560ms
- Followed closely by Google Optimize at 569ms
- Both VWO and CrazyEgg were slower, timing at 725ms and 810ms respectively
- Convert.com was recorded at 1230ms
- Whereas FigPii was significantly slower at 2200ms
* Lower LCP times indicate better performance
2. Impact on STTV

When it comes to STTV:
- Google Optimize took the shortest time at 396ms
- Mida.so wasn't far behind with 432ms
- VWO, CrazyEgg, and Convert.com had STTV times of 587ms, 698ms, and 991ms respectively
- FigPii once again had the slowest timing at 2052ms
* Lower STTV times also indicate better performance
3. Impact on network requests
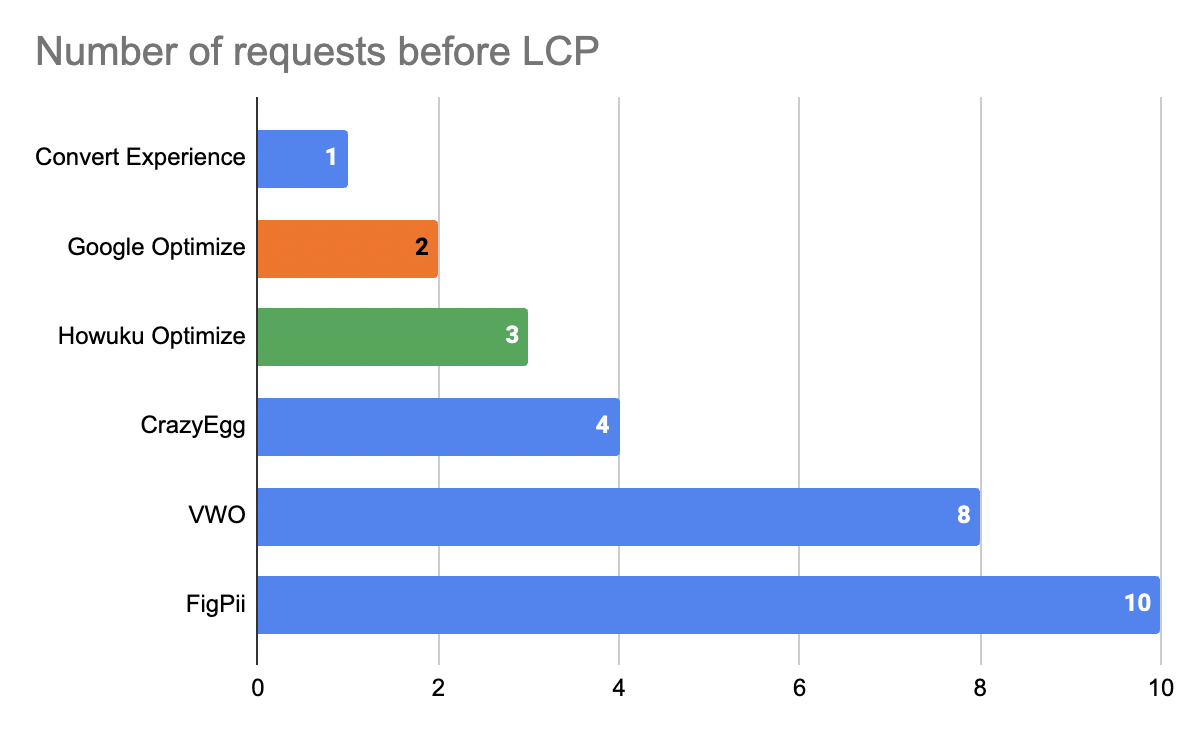
The number of requests were sent before LCP:
- Convert Experience only loads ONE single 203KB JS file
- Google Optimize will need to load ONE optimize.js and another ONE for analytics.js file for it to work
- Mida.so only need to load ONE optimize.js file and another 2 HTTP requests to register the visitor and retrieve test profiles
- CrazyEgg is pretty similar to Mida.so in that sense
- However, VWO and FigPii need to load 8+ script prior to LCP loading and it is obviously not a good thing
* Lower number of requests can improve your SEO performance
4. Impact on script sizes

Moreover, we found a significant difference in the size (uncompressed) of each tool:
- The smallest was Mida.so at 15.3kb
- Google Optimize and CrazyEgg were relatively heavier at 131kb and 128kb respectively
- FigPii was the largest tool by a significant margin, measuring up at 446kb
- Convert.com and VWO fell somewhere in the middle at 203kb and 254kb respectively
* Smaller sizes indicate faster loading times and better performance
Detailed results and experience can be viewed through the respective report for each tool.
Desktop device test

Mobile device test
These results certainly illustrate that the choice of an A/B testing tool can have an impact on your website speed. With the diversity between the fastest and slowest tools so substantial, it's clear that the choice of a tool could be as relevant as the cost, ease of use, or other common factors marketers take into account during the selection process.
We hope this study will be beneficial to you in finding the balance between optimizing your webpage through A/B testing and maintaining the website speed, ultimately leading to improved user experience and, of course, more revenue.
Conclusion
Before wrapping this up, let's remember one crucial thing: speed matters. Your website's performance has a direct impact on your user experience, search engine ranking, and ultimately, your bottom line. Every millisecond matters in the digital world, and it's crucial to minimize any potential factors that could bog down your website.
From our study, it's clear that A/B testing tools can have a varying impact on your website's speed. Tools like Mida.so and Google Optimize come out on top in terms of speed, while others, such as FigPii, may need more time to load. But it's also important to remember that speed isn't the only factor to consider. These tools come with their own unique features and benefits that may make them the right fit for your specific needs.
Our recommendation? Maintain a balanced approach. While you'll want a tool that allows you to conduct comprehensive A/B tests to optimize your website, it's equally important to ensure that your website maintains a fast speed to provide an excellent user experience. Do your due diligence, assess your needs, understand the capabilities and speed of each tool, and choose wisely.
Finally, this is a conversation and learning process – both for us and for our readers. We invite you to share your experiences with any A/B testing tools. Your feedback can provide invaluable insights to us and our audience. Be it your struggles, successes, or simply tips about using these tools, your shared experiences can help many others make more informed decisions.
At the end of the day, the objective of such studies and ongoing discussions is to better understand and improve the critical relationship between website optimization and performance speed. It's about finding the right mix that delivers a winning user experience. So, let's continue exploring, learning, and sharing as we navigate the ever-evolving landscape of digital marketing together.
We hope our findings will assist you in your quest for an ideal A/B testing tool, saving you time, improving your site's performance, and ultimately helping your brand flourish online.
Reference
Here are some sources and references that inspired us to conduct this test.
- CXL - How 8 Different A/B Testing Tools Affect Site Speed (Original Study)
- Convertize - 7 Ways to Avoid Loading Speed Issues in A/B Testing
- Convert.com - How Does A/B Testing Impact Your Site Speed? Find Out Here