Start A/B Testing Your Website Today
How To Setup Google Analytics Heatmap In 2023 (Updated for GA4)

As a website owner, you want to know where your visitors are clicking on your site so you can make sure they're seeing the information you want them to see, and you can use the Google Analytics heatmap to do just that.
In this post, we are going to show you what are the benefits of a heatmap and how you can set up one for your website and unlock aggregated user insights. Although Google has stopped supporting its heatmap add-on since 2019, you can still use it for your day-to-day heatmap analysis.
Let's get right into it!
What is a website heatmap?
Website heatmap is one of the most popular tools analysts and marketers use to track user behavior and understand how users interact with digital products.
A heatmap is a graphical representation of how users interact with a web page. The colors represent different levels of interaction, with red being the highest level and blue being the lowest.
Heatmaps can be a valuable tool for identifying areas of your website that need improvement. If you see an area of your website that is not getting enough clicks, you can make changes to that area to try and increase the number of clicks it gets. Similarly, if you see an area of your website that is getting too many clicks, you can make changes to try and reduce the number of clicks it gets.
The benefits of heatmaps
There are a number of benefits to using heatmaps on your site.
1. Increased understanding of user behavior
Heatmaps provide valuable insights into how users interact with digital products. This information can be used to improve the user experience and make products more user-friendly.
2. Improved marketing campaigns
Heatmaps can be used to track the performance of marketing campaigns and understand which elements are most effective at driving engagement. This information can be used to optimize future campaigns for better results.
3. Improved conversion rates
By understanding where users are clicking, tapping, or hovering on a page, businesses can make design changes that lead to improved conversion rates.
4. Reduced costs
By understanding which elements of a product are most popular with users, businesses can reduce the costs associated with development and production.
5. Increased customer satisfaction
Heatmaps can be used to track customer satisfaction with a product or service. This information can be used to make necessary changes to improve satisfaction levels.
What is the Google Analytics heatmap?
Google Analytics is a free web analytics service that tracks and reports website traffic. It is the most popular web analytics service on the internet which can be used to track both organic and paid traffic, and it provides a wealth of data that can be used to improve your website.
One of the most demanded features is the ability to track website heatmaps. Heatmaps are a visual representation of where users click on your website. They can be used to identify areas of your website that are getting a lot of clicks, or areas that are not getting enough clicks.
Does Google Analytics 4 support heatmaps?
The answer is no.
Google Analytics 4 does not support heatmap and there is no official word from Google on whether or not they plan to add this feature in the future.
However, you can still use it with the old way of installing its heatmap through the Chrome Extension called "Page Analytics".
Here is how you can do it.
How to set up Google Analytics heatmap?
In just 3 simple steps, you can start using Google's heatmaps to track your website data.
1. Install Chrome Extension
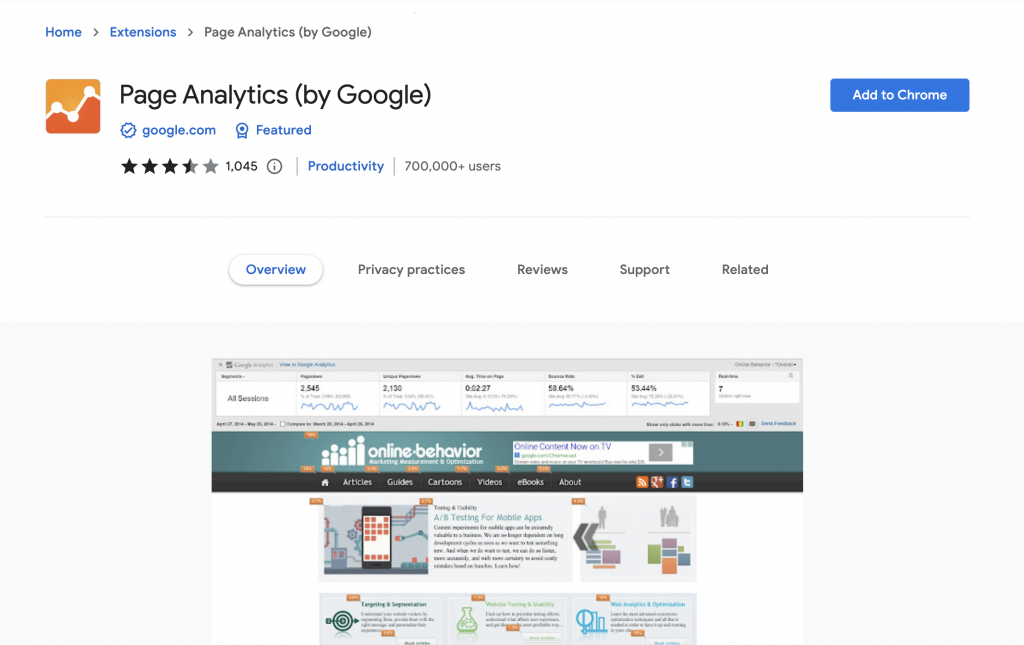
In order to start using heatmap with GA, you will have to go to the Chrome Extension store and look for Page Analytics Chrome Extension (By Google) and install the Google Analytics heat map extension to start using heatmap.
2. Activate the Chrome extension
Once you have installed it, go to your website and click on the Page Analytics app on top of your Chrome browser, and it should show that you have successfully installed it.
However, you will need an account and have Analytics code installed on your website as the basic prerequisite to using Google Heat Map.
3. Analyze your website with Google Analytics heatmap
You can start using the Heatmap on your website by clicking on the Message Bubble icon, and it will show you the percentage of clicks threshold you get on each of the elements on your site.
You will also get other Google Analytics data such as the time on page bounce, the number of visits and etc.
There you go, that is all you need to do to set up Google heat maps.
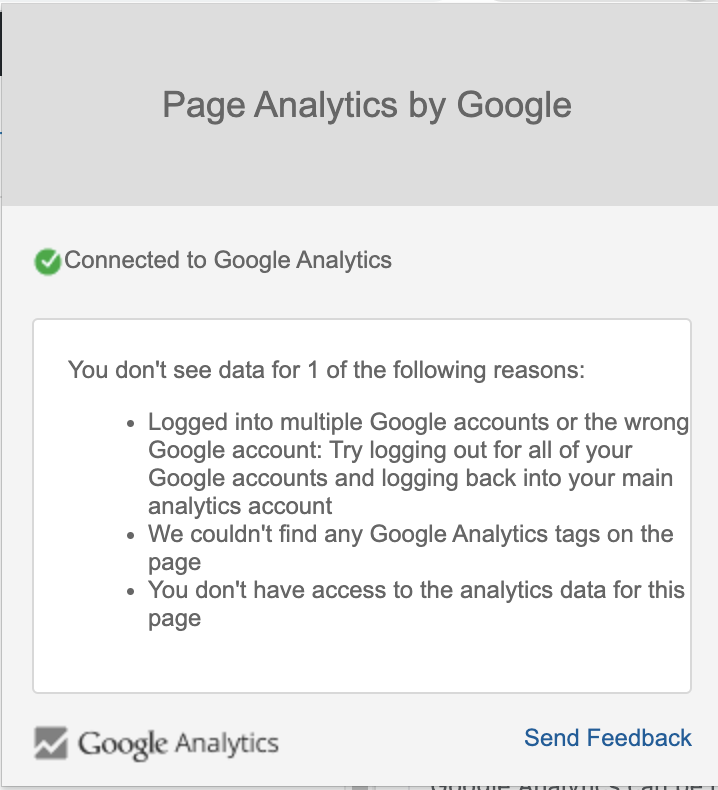
Issues with Google Analytics heatmap
If you have completed all the steps above but the heatmap does not show up properly for your website.
You shouldn't feel bad about it. You are not alone as it has also happened to many other people as well.
Since Google stopped supporting it in 2019, it is no surprise that it may not be working out for you.
These are some of the comments that you can find under the Page Analytics Chrome Extension page:

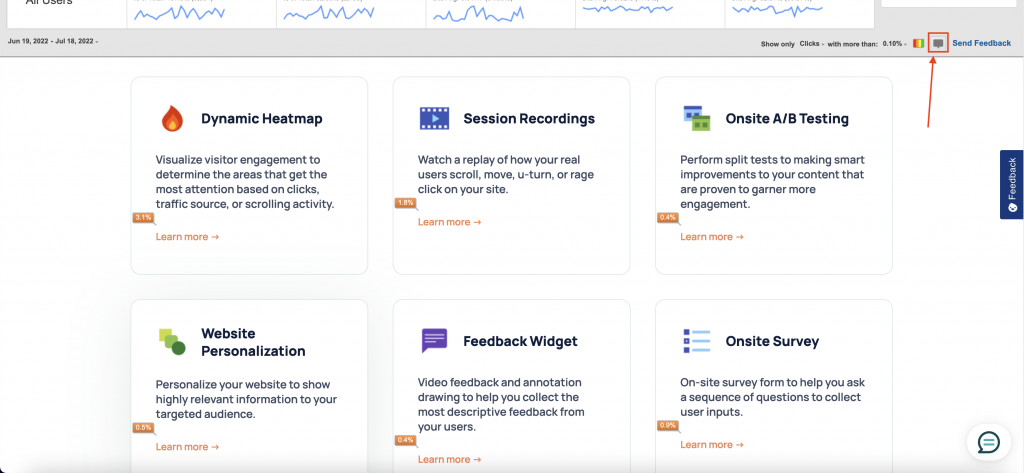
Alternatives to Google Analytics heatmap
If for any reason it didn't work out for you, there are a lot of good heatmap options other than GA Heatmap.
You can always try out Howuku's Dynamic Website Heatmap or you can check out one of our blog posts on the best heat mapping tool in 2022 which covers the best heatmap option that you can use for your website.
Here is a side-by-side comparison of what Howuku and Google heat maps look like:


With Howuku heatmap, you get a dynamically generated heatmap for your websites. It means that even if you have changed your website layout over time. We will still be able to keep track of the precise positioning of your new elements with the new hotspot.
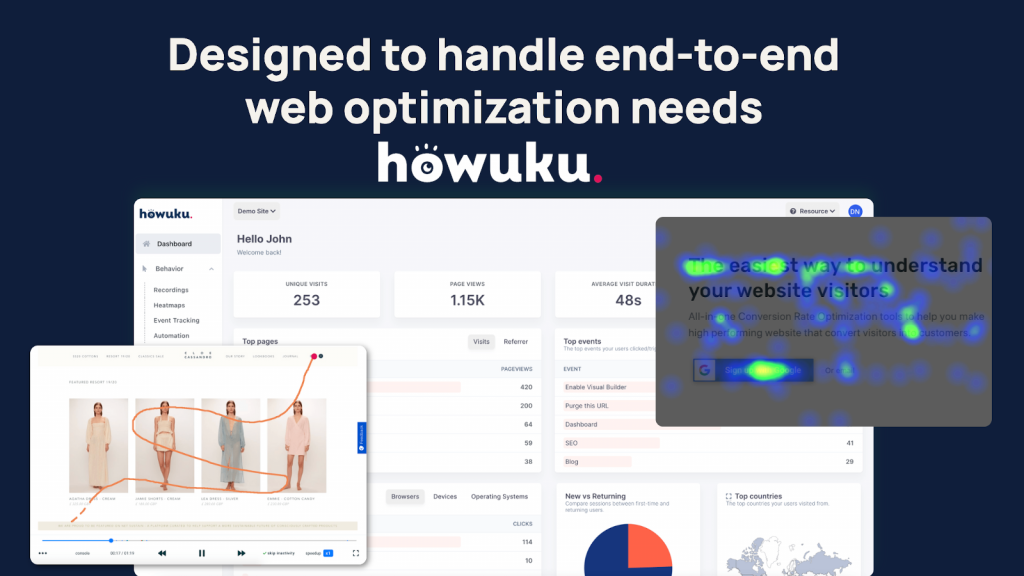
What is Howuku: User Behavior Analytics?
Howuku is an all-in-one web optimization platform to help you truly understand your website visitors and improve your conversion rates through various UI/UX features such as Heatmap, Session Recording, A/B Testing, Conversion Funnel, and more.
How to set up Howuku heatmap?
The installation process for Howuku heatmaps is very simple, you don't need to download any Chrome Extension and cluster your browser.
1. Create an account with Howuku
Create a new account or use your existing Howuku account if you already have one.
2. Install tracking code
We support some of the most popular CMS and E-commerce store integration that you can just install our plugin and start tracking your website data with Howuku.
Follow one of our installation guides to install the tracking code on your website.
3. Analyze your website heatmap data
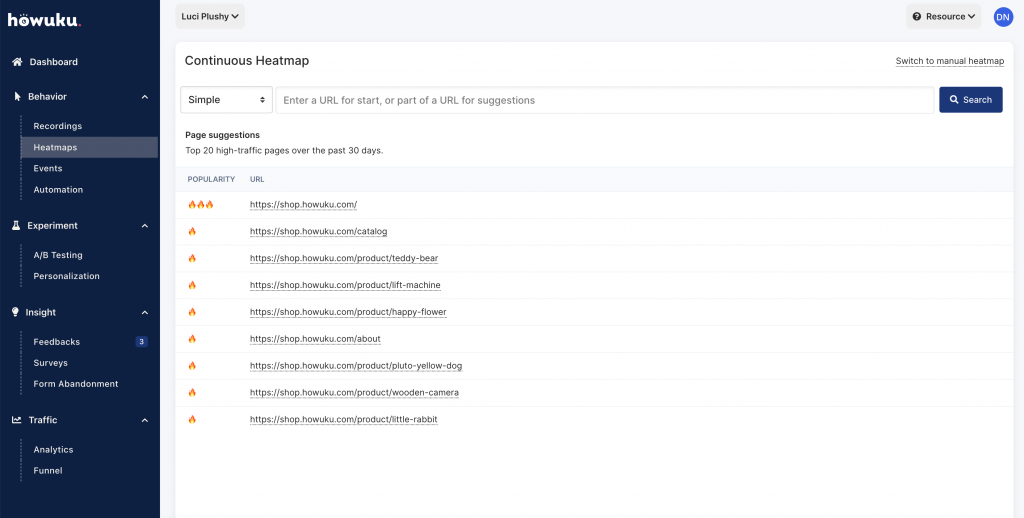
After you have installed Howuku on your website, you should be able to start seeing new Heat Map data showing up on your Howuku dashboard as soon as new visitors have landed on your site.
You can find all heatmap reports in your Howuku app and just click on any page to view the heatmap report.
More than just another heatmapping tool
You would be surprised to find out what you can do with Howuku, and how much you can achieve with an all-in-one conversion optimization tool.
We have the most comprehensive set of optimization features ready to help you fully understand your website visitors through session recording, A/B testing, form analytics, and conversion funnel.
But, can you use Howuku with Analytics?
Yes, Howuku goes hand in hand with your GA account. In fact, Howuku compliments GA very well, you have all the cool charts and graphs from Analytics, visualize data, and detailed visitor data insights journey with Howuku.
However, Howuku also comes with its own analytics feature that gives you a much higher accuracy insight into your website traffic since we do not do data sampling on your data, so we will always have much higher traffic counts recorded compared to Google.
Learn more about Howuku Analytics here.

Conclusion
Overall, it should be a fairly simple process to set up a heatmap for your website. By following the steps outlined in this blog post, you should be able to get your heat map up and running in no time.
Additionally, using a heat map can be a great way to get more insight into how your website visitors are interacting with your site.
Let me know in the comment if the Google Analytics heatmap works for you.
Get Access To A FREE 100-point Ecommerce Optimization Checklist!