Guide to Analyzing User Journey in Google Analytics

As websites become more complex, it's harder for businesses to make sure their site works well for users. Studies show that a well-designed site can make a big difference: it can increase the number of people who complete an action on the site by 200% to 400%. But understanding and improving the way users move through a site can be difficult without the right tools.
Google Analytics can help with this problem. It has many features that make it easy for businesses to see how users experience their sites. By using these tools, website owners can find issues that might be causing problems for users. Fixing these issues can lead to a better experience for users, more people completing actions on the site, and more money for the business.
This post will break down the different methods and features in Google Analytics to help you discover, map, and troubleshoot user journeys on your website.
Segmentation for user journey
Segmentation is a powerful feature in Google Analytics that allows you to analyze subsets of your data based on specific criteria. By applying segmentation to user journey analysis, you can better understand how different groups of users interact with your website, identify patterns, and optimize your website accordingly. Here is how you can use segmentation for user journey analysis.
Creating Custom Segments
Custom segments allow you to define specific criteria to isolate and analyze particular groups of users or sessions. Some examples of custom segments for user journey analysis include:
- Users who have completed a specific goal (e.g., newsletter sign-ups or product purchases)
- Users who have visited a specific set of pages
- Users who have engaged with particular elements on your site (e.g., video plays or downloads)
- Users from a specific traffic source (e.g., organic search, social media, or email campaigns)
By analyzing these custom segments, you can gain valuable insights into the user journeys of different groups and tailor your optimization strategies accordingly.
Applying Segments to Reports
Once you have created custom segments or selected predefined segments, you can apply them to various reports in Google Analytics to enhance your user journey analysis. Some useful reports to apply segments to include:
- All Pages report: Identify the pages users in a specific segment visit most frequently and the order in which they visit them.
- Behavior Flow report: Visualize the paths users within a segment take through your website, and identify any potential bottlenecks or drop-off points.
- Goal Flow report: Analyze the steps users in a segment take to complete specific goals and identify opportunities for improvement.
Applying segments to these reports can help you uncover trends, patterns, and potential issues specific to different groups of users.
Sequencing Rules for Segments
Sequencing rules allow you to create segments based on the order in which users perform specific actions on your website. By using sequencing rules, you can build custom funnels to analyze the user journey from start to finish. For example, you can create a segment to analyze the journey of users who:
- Viewed a specific product page, then added the product to their cart, and finally completed a purchase
- Visited your homepage, then navigated to a specific blog post, and finally signed up for your newsletter
Sequencing rules in segments help you understand the steps users take to complete specific actions and identify any areas for optimization within these journeys.
Analyzing Drop-off Points with Segments
Segments can also help you analyze drop-off points within user journeys. By creating segments for users who drop off at specific steps in a funnel, you can investigate the reasons behind their exit and identify opportunities for improvement. For example, you can create a segment for users who abandoned their shopping cart without completing a purchase and analyze their behavior prior to abandonment to determine potential issues or areas for optimization.
Behavior Flow Report
The Behavior Flow report in Google Analytics is a visual representation of the paths users take through your website, showing the journey from the initial landing page to subsequent pages and exit points. This report provides valuable insights into user behavior, content engagement, and potential issues with your site's navigation and structure.

Understanding the Behavior Flow Report Structure
The Behavior Flow report is structured as a flowchart, with nodes representing pages or content groupings and connections representing the user's movement between them. The report is divided into several columns:
- Starting Pages: The first column shows the initial landing pages where users enter your website.
- First Interaction: The second column displays the first page users navigate to after the starting pages.
- Second Interaction, Third Interaction, and so on: Subsequent columns represent the next steps users take in their journey through your website.
The thickness of the connections between nodes indicates the volume of users following that particular path. The report also shows drop-offs, which are the points where users exit your site.
Adjusting Granularity with Content Groupings and Events
By default, the Behavior Flow report displays data based on individual pages. However, you can adjust the granularity of the report by using content groupings or events. Content groupings allow you to categorize similar pages together, making it easier to analyze user behavior across broader sections of your site. Events, on the other hand, let you track specific user interactions, such as button clicks or form submissions, and visualize them within the Behavior Flow report.
To use content groupings or events in the Behavior Flow report, simply select the desired option from the drop-down menu at the top of the report.
Applying Segments to the Behavior Flow Report
To further refine your user journey analysis, you can apply segments to the Behavior Flow report. By applying custom or predefined segments, you can isolate and analyze the behavior of specific groups of users, such as those who completed a goal or visited a particular set of pages. This helps you uncover trends and patterns unique to different user groups and optimize your website accordingly.
Navigating the Behavior Flow Report
The Behavior Flow report offers various navigation options to help you explore the user journey in detail:
- Hover over nodes and connections to view additional information, such as the number of users and drop-offs.
- Click on a node to highlight the specific path users took from that point, making it easier to follow their journey.
- Use the "Explore traffic through here" option to isolate a specific part of the flow and view only the traffic that passes through that point.
Analyzing User Behavior and Identifying Opportunities for Improvement
By studying the Behavior Flow report, you can gain insights into user behavior and identify opportunities for optimization:
- Popular content: Identify the most frequently visited pages and ensure they are easily accessible and up-to-date.
- High drop-off points: Locate areas with high exit rates and investigate potential issues, such as confusing navigation, poor content quality, or technical problems.
- Unexpected user paths: Discover user journeys that deviate from your intended site structure and optimize your navigation to facilitate a smoother experience.
User Explorer
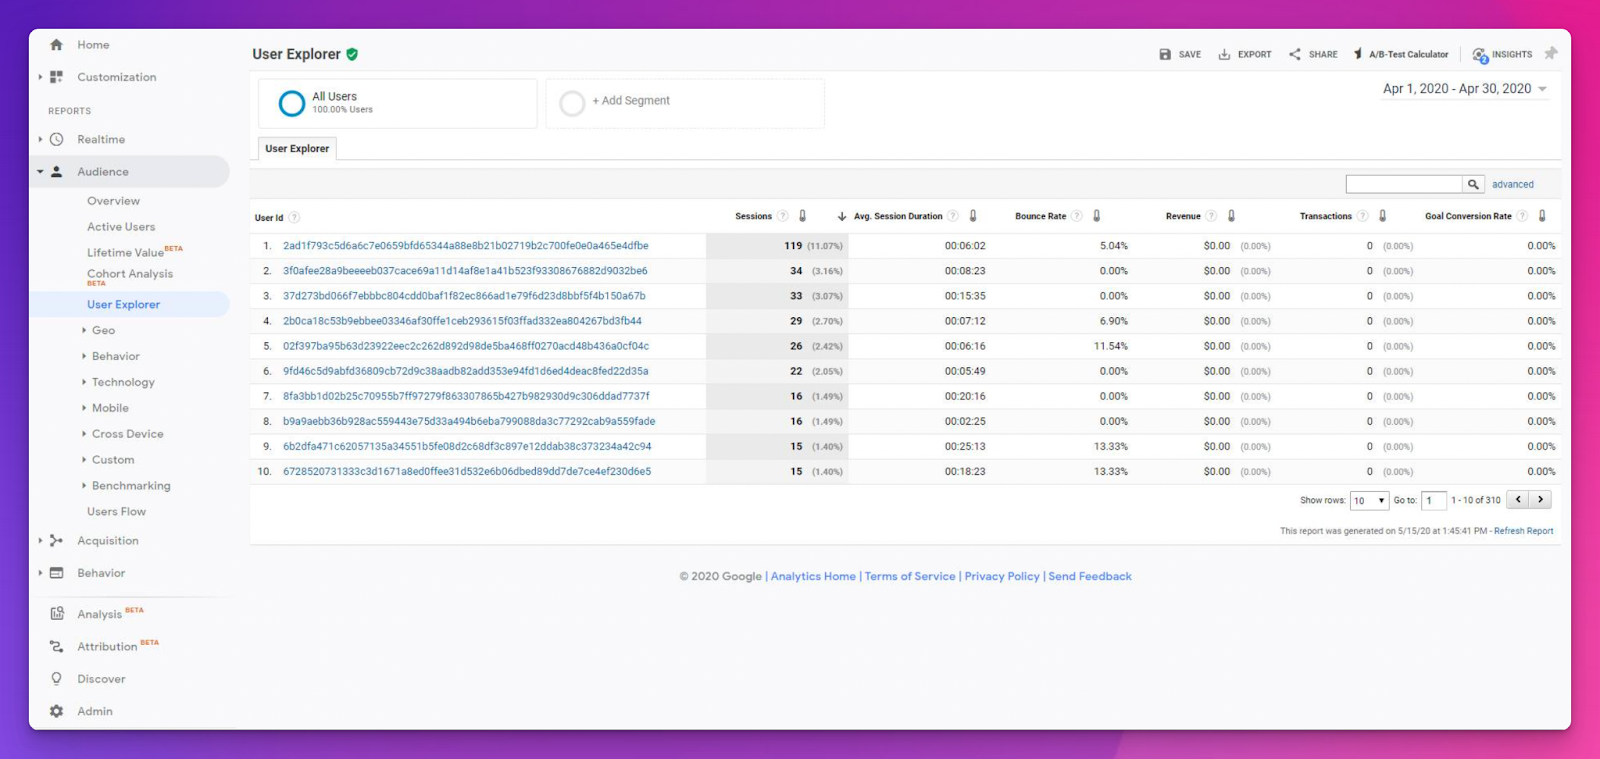
The User Explorer report in Google Analytics provides a detailed view of individual user journeys, allowing you to analyze the behavior of specific users on your site. By examining the pages and events performed by each user, you can gain insights into their preferences, pain points, and overall experience.
Enabling the User-ID Feature
Before you can use the User Explorer report, you must enable the User-ID feature in your Google Analytics property settings. The User-ID feature assigns a unique identifier to each user, allowing Google Analytics to track their interactions across multiple sessions and devices. To enable the User-ID feature, follow these steps:
- Sign in to your Google Analytics account and navigate to the Admin section.
- In the Property column, click on "Tracking Info," then select "User-ID."
- Read the User-ID Policy and check the box to agree, then click "Next."
- Follow the on-screen instructions to set up and configure the User-ID feature.
Accessing the User Explorer Report
Once you have enabled the User-ID feature, you can access the User Explorer report by navigating to Audience > User Explorer in your Google Analytics account. The report displays a list of individual users, along with their User-ID, the number of sessions, and various engagement metrics, such as the average session duration and bounce rate.
Analyzing Individual User Journeys
By clicking on a specific User-ID, you can view a detailed timeline of that user's interactions with your site. The timeline includes information about the pages visited, events triggered, goals completed, and any transactions made. By examining these individual user journeys, you can:
- Identify common patterns and trends among users who perform specific actions, such as making a purchase or signing up for a newsletter.
- Detect potential issues or pain points that may be hindering user experience or causing users to abandon their journey.
- Gain insights into the effectiveness of your site's navigation, content, and calls to action.
Using Segments to Filter User Explorer Data
To make your analysis more targeted, you can use segments to filter the data displayed in the User Explorer report.
By applying custom or predefined segments, you can isolate specific groups of users based on their behavior or attributes, such as users who completed a particular goal, visited a specific set of pages, or originated from a certain traffic source.
This allows you to analyze the user journeys of different groups more effectively and tailor your optimization strategies accordingly.
Previous Page Path
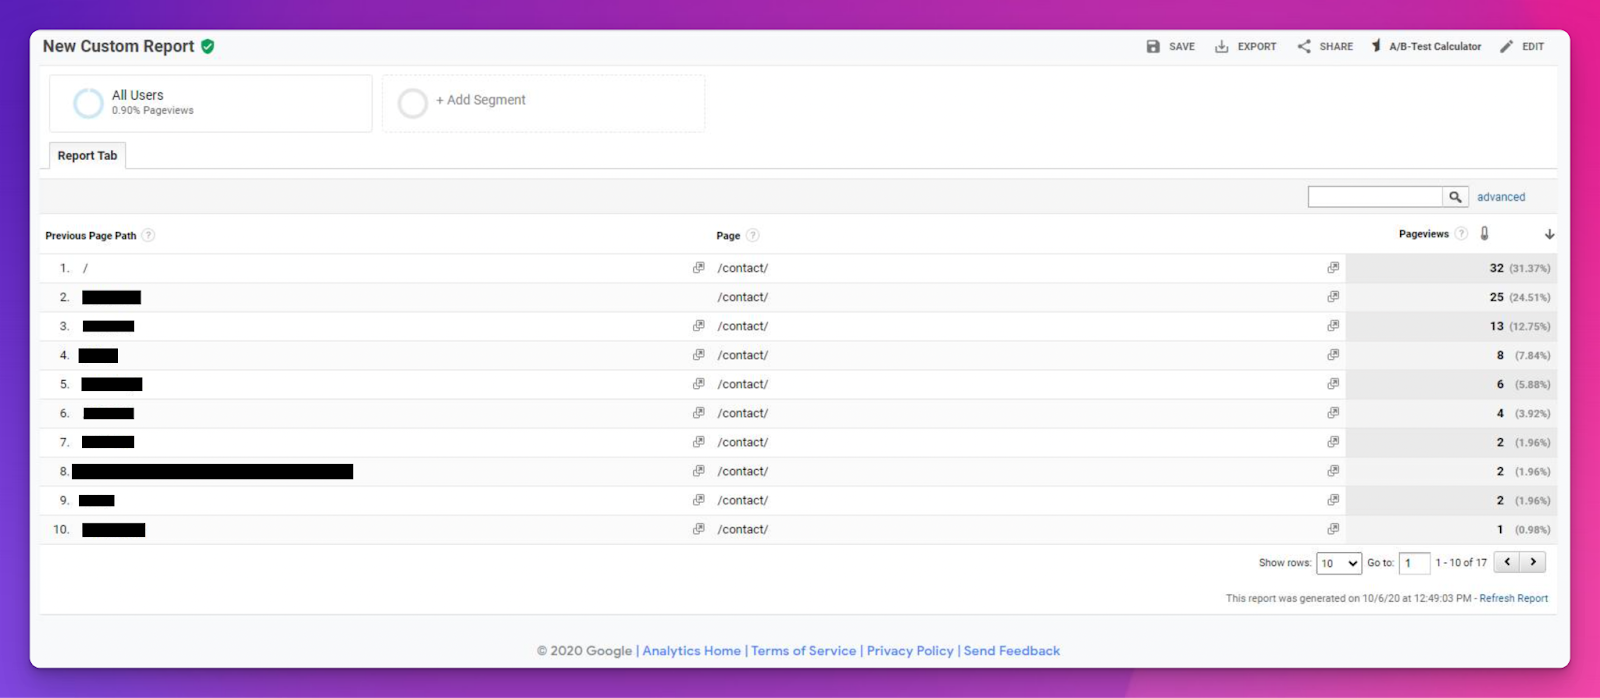
The Previous Page Path dimension in Google Analytics is an effective tool for analyzing user navigation to specific pages on your website. By understanding the pages that lead users to perform specific actions, such as visiting a "Contact Us" page or making a purchase, you can optimize these pages and enhance user journeys.
Understanding the Previous Page Path Dimension
The Previous Page Path dimension refers to the page a user was on immediately before navigating to the current page. This information helps you identify the most common pathways users take to reach particular pages and understand the relationship between different pages on your site.
Accessing the Previous Page Path Data
To view the Previous Page Path data in Google Analytics, follow these steps:
- Sign in to your Google Analytics account and navigate to the Behavior section.
- Click on "Site Content" and then select "All Pages."
- In the report, change the primary dimension to "Previous Page Path."
You can also add the Previous Page Path dimension to custom reports or use it in combination with other dimensions and metrics for more advanced analysis.
Analyzing User Navigation with Previous Page Path Data
Using the Previous Page Path dimension, you can gain valuable insights into user navigation and identify opportunities for optimization:
- Discover popular navigation paths: Identify the most common routes users take to reach specific pages and ensure these pathways are clear and user-friendly.
- Uncover unexpected navigation patterns: Detect unusual or unexpected user paths that may indicate issues with your site's navigation or content organization.
- Optimize pages that drive user actions: Analyze the pages leading users to perform specific actions, such as completing a form or making a purchase, and optimize these pages to encourage more users to take the desired action.
Combining Previous Page Path Data with Segments and Filters
To further refine your user journey analysis, you can use segments and filters in conjunction with the Previous Page Path dimension:
- Apply segments to isolate specific user groups based on their behavior or attributes, such as new vs. returning visitors or users who completed a particular goal.
- Use filters to narrow down the data to specific pages, traffic sources, or other criteria, making it easier to analyze user navigation for specific scenarios.
Checkout Behavior and Shopping Behavior
The Checkout Behavior and Shopping Behavior reports in Google Analytics are essential tools for analyzing user journeys in an e-commerce context. These reports are part of the Enhanced E-commerce tracking feature and provide valuable insights into user interactions with your online store.
Setting Up Enhanced E-commerce Tracking
To access the Checkout Behavior and Shopping Behavior reports, you must first enable Enhanced E-commerce tracking for your Google Analytics property. This feature allows you to track detailed e-commerce data, such as product impressions, add-to-cart actions, and completed transactions. Follow the steps provided in the Google Analytics Help Center to set up Enhanced E-commerce tracking for your website.
Understanding the Shopping Behavior Report
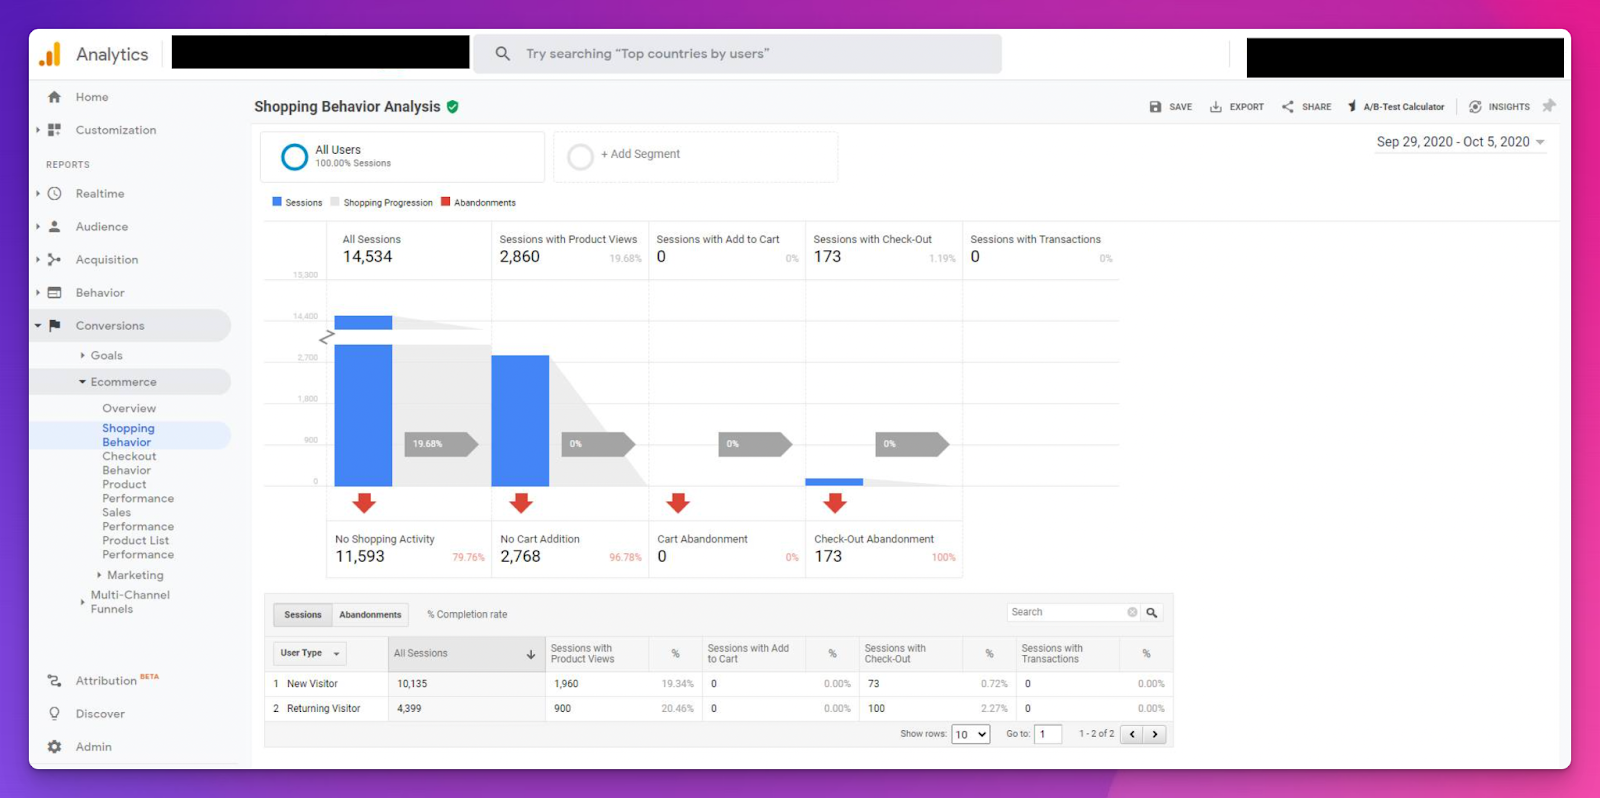
The Shopping Behavior report provides a high-level overview of your users' shopping experience, from viewing products to completing transactions. This report can be found in your Google Analytics account under Conversions > Ecommerce > Shopping Behavior.
Key insights from the Shopping Behavior report include:
- The percentage of users who progress through each stage of the shopping journey, such as viewing a product, adding it to their cart, and completing a transaction.
- Drop-off points where users abandon the shopping journey, which can help you identify areas for improvement.
- The impact of marketing campaigns and traffic sources on user shopping behavior, allowing you to optimize your promotional efforts.
Analyzing the Checkout Behavior Report
The Checkout Behavior report focuses on the checkout process itself, highlighting potential drop-off points and areas for improvement. This report can be found in your Google Analytics account under Conversions > Ecommerce > Checkout Behavior.
Key insights from the Checkout Behavior report include:
- The percentage of users who progress through each step of the checkout process, such as entering billing information, selecting a shipping method, and confirming their order.
- The drop-off points where users abandon the checkout process, which can help you identify and address barriers to conversion.
- The effectiveness of different checkout optimizations, such as guest checkout or simplified forms, in reducing drop-off rates and increasing conversions.
Using Segments and Filters for In-Depth Analysis
For more targeted user journey analysis, you can apply segments and filters to the Checkout Behavior and Shopping Behavior reports:
- Use segments to isolate specific user groups based on their behavior, demographics, or traffic sources, allowing you to understand how different segments interact with your e-commerce store.
- Apply filters to focus on specific products, categories, or other criteria, making it easier to analyze user behavior for specific scenarios and optimize your online store accordingly.
Site Search Analysis
Site Search analysis in Google Analytics allows you to track and analyze the search terms users enter into your website's internal search function. This valuable data can help you identify content gaps, understand user intent, and optimize your site's navigation and content structure.
Setting Up Site Search Tracking
To enable Site Search tracking in Google Analytics, follow these steps:
- Sign in to your Google Analytics account and navigate to the Admin section.
- In the View column, click on "View Settings."
- Scroll down to the Site Search Settings section and toggle the button to enable Site Search Tracking.
- Enter the query parameter used by your website's internal search function (e.g., "q" or "s"). This is usually found in the URL of the search results page.
- Optionally, enable Site Search Categories if your website uses them.
- Save your changes.
Once Site Search tracking is enabled, data will begin to populate in your Google Analytics reports.
Accessing and Analyzing Site Search Data
To view and analyze Site Search data, follow these steps:
- In your Google Analytics account, navigate to the Behavior section.
- Click on "Site Search" and select "Overview" or "Search Terms" to view the search data.
Key insights from Site Search analysis include:
- Most frequently searched terms: Understand what information or products users are actively seeking on your site.
- Search terms with low click-through rates: Identify content gaps or areas where users are struggling to find the desired information, indicating a need for content optimization or improved navigation.
- Trends in search behavior: Monitor changes in search patterns over time to identify emerging user needs and interests.
Applying Segments and Filters for Advanced Analysis
To further refine your Site Search analysis, you can use segments and filters in combination with the Site Search data:
- Use segments to isolate specific user groups based on their behavior, demographics, or traffic sources, allowing you to understand how different user segments interact with your site's search function.
- Apply filters to focus on specific search terms, categories, or other criteria, making it easier to analyze search behavior for specific scenarios and optimize your site accordingly.
Leveraging Site Search Data for User Journey Optimization
Site Search analysis can inform various aspects of user journey optimization, including:
- Content creation: Develop new content or update existing content based on popular search terms and user intent.
- Navigation and site structure: Improve your site's navigation and organization to make it easier for users to find the information they're searching for.
- Internal linking: Adjust your internal linking strategy to guide users to relevant content more effectively.
Custom Funnels and Advanced Analysis
Understanding user journeys is crucial for optimizing your website's performance and user experience. Custom Funnels and Advanced Analysis in Google Analytics provide different levels of depth and customization to help you analyze and optimize user journeys on your site.
Custom Funnels
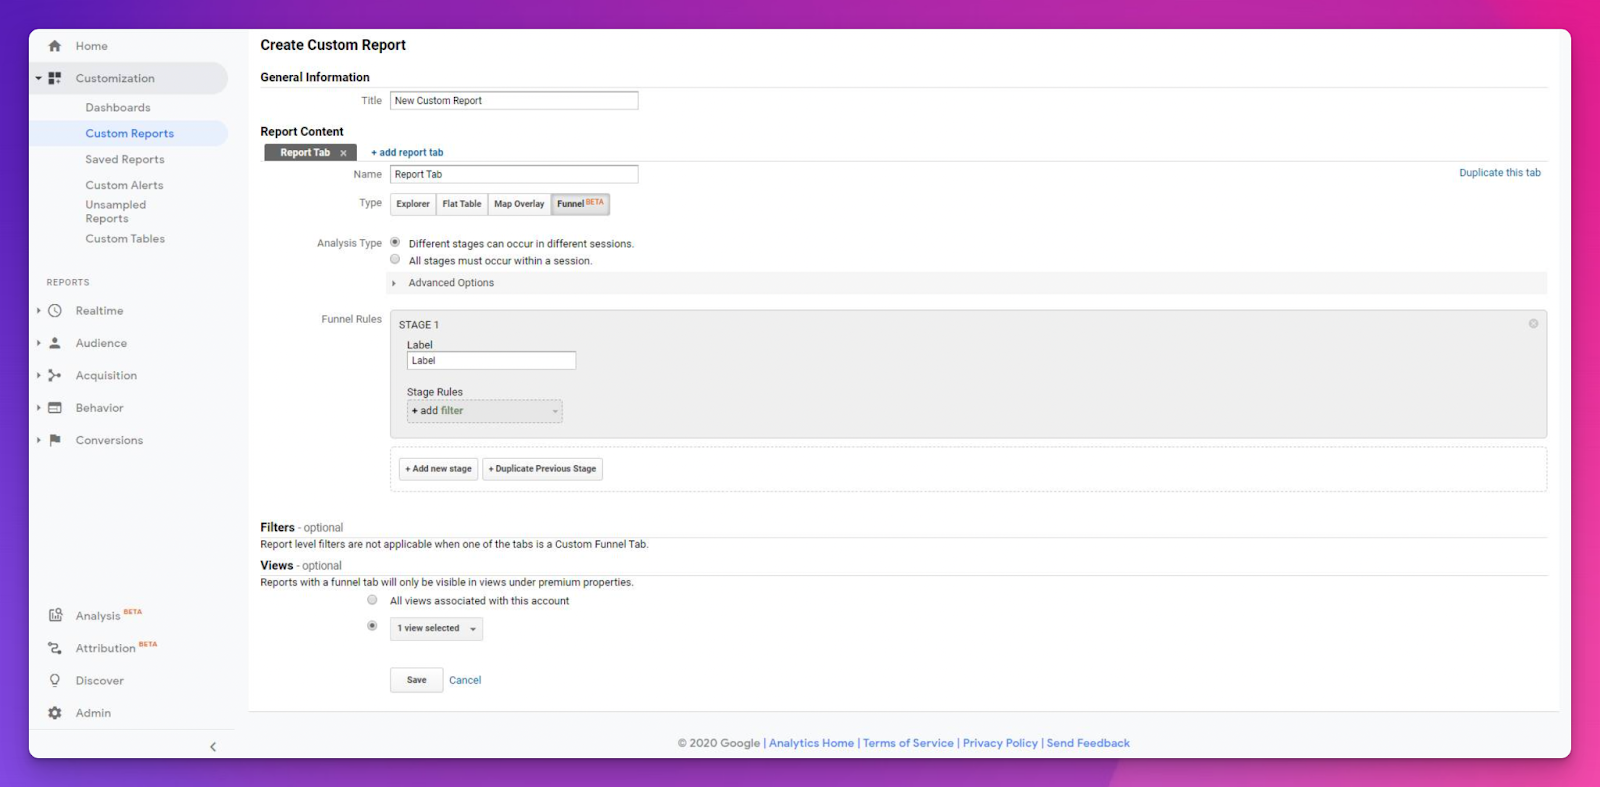
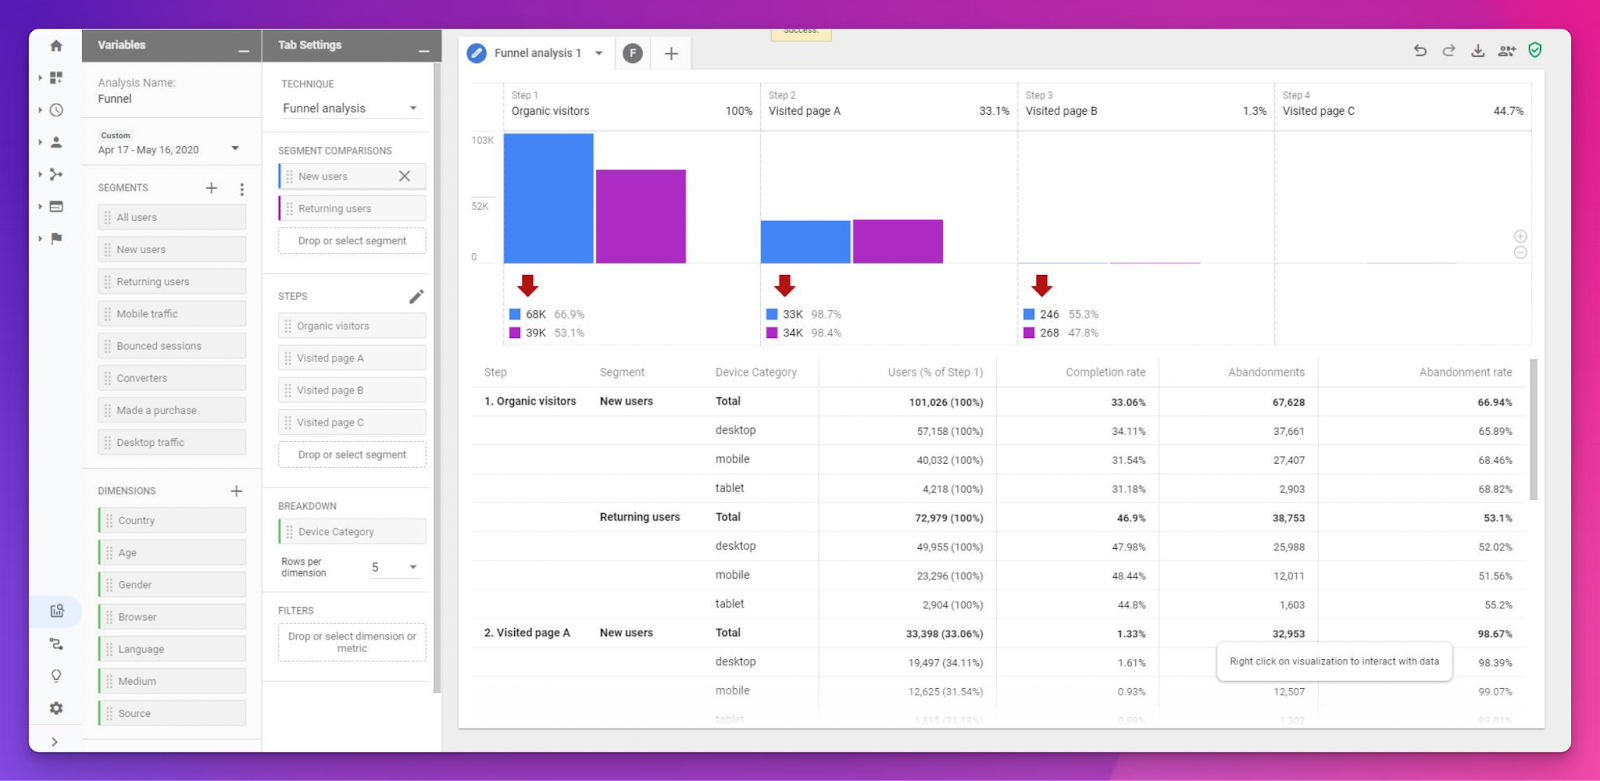
Custom Funnels in Google Analytics allow you to create and visualize user journeys for specific actions on your site. You can define each step in the funnel, monitor user progression, and identify drop-off points. Here's how to create a custom funnel:
- Sign in to your Google Analytics account and navigate to the Customization section.
- Click on "Custom Reports" and then "New Custom Report."
- Select "Funnel" as the report type.
- Define each step in your funnel by providing a name and specifying the page or event that represents that step.
- Configure additional settings such as funnel type (open or closed), session type (single or multi-session), and step requirements (sequential or non-sequential).
- Save your custom funnel and view the report to analyze user progression and drop-offs.
Using custom funnels, you can:
- Monitor user progression through the funnel, identifying points where users drop off or divert from the intended journey.
- Build segments based on users who drop off at specific points, allowing you to spot trends or issues that cause users to leave the funnel.
- Optimize your site and user journeys by addressing pain points and barriers identified through funnel analysis.
Advanced Analysis
Advanced Analysis, available exclusively in Google Analytics 360, offers a more in-depth approach to funnel analysis. With additional features such as the ability to analyze up to 10 steps and apply segments and dimensions to your funnel, Advanced Analysis provides deeper insights into user journeys.
To create a funnel in Advanced Analysis, follow these steps:
- Sign in to your Google Analytics 360 account and navigate to the Customization section.
- Click on "Advanced Analysis" and choose "Funnel Analysis" as the report type.
- Define each step in your funnel, including names and associated pages or events.
- Apply segments and dimensions to further refine and analyze your funnel, understanding how different user groups progress through the journey.
- Save your analysis and use the insights gained to optimize user journeys and address pain points.
Advanced Analysis offers several advantages over Custom Funnels, including:
- More granularity in funnel definition, with up to 10 steps and additional options for step requirements.
- The ability to apply segments and dimensions, allowing you to understand user progression in different user groups and contexts.
- A deeper level of analysis for identifying trends and issues, enabling more informed decisions for user journey optimization.
Conclusion
In summary, understanding user journeys is essential for optimizing your website and increasing conversions. While Google Analytics offers a range of powerful tools and features for analyzing user journeys, it can be complex and time-consuming to set up and navigate.
As an alternative, consider using Howuku, an all-in-one website analytics and optimization platform designed to make user journey analysis simple, efficient, and effective.
Howuku offers a comprehensive suite of UX and optimization tools, including heatmap, session recording, survey, analytics, A/B testing, funnel analysis, and more. By leveraging these features, you can gain valuable insights into user behavior, identify areas for improvement, and optimize your website for enhanced user experience and higher conversion rates.
Here's how Howuku simplifies user journey analysis and optimization:
- Streamlined data collection and analysis: Howuku's user-friendly interface and intuitive features make it easy to collect, analyze, and interpret data, enabling you to quickly identify trends, pain points, and opportunities for improvement.
- All-in-one platform: With Howuku, you have access to a comprehensive set of analytics and optimization tools in a single platform, eliminating the need to juggle multiple tools and integrations.
- Actionable insights: Howuku provides clear, actionable insights that empower you to make data-driven decisions on website design, content strategy, and marketing initiatives, ensuring your efforts are aligned with user needs and preferences.
- Personalized user experience: Howuku enables you to segment users based on their behavior and demographics, allowing you to tailor content, offers, and messaging to resonate with specific user groups, further enhancing the overall user experience and driving higher engagement and conversions.
- Continuous optimization: Howuku's robust feature set, including A/B testing and funnel analysis, helps you continuously monitor, analyze, and optimize user journeys, ensuring your website remains user-centric and effective at meeting the needs of your visitors.
By choosing Howuku as your analytics and optimization platform, you can simplify the process of understanding and optimizing user journeys, resulting in a better user experience, increased conversions, and sustainable growth for your online business.
Get Access To A FREE 100-point Ecommerce Optimization Checklist!


